From the browser to the cloud, ManagedMethods provides easy, affordable cybersecurity and student safety monitoring for technology leaders who need to secure online learning on a tight budget

LEADERS IN K-12 DATA SECURITY & CYBER SAFETY
“When I first learned about ManagedMethods I was skeptical that such an inexpensive solution would be able to secure our Google Workspace data better than Cloudlock. However, after our first week using the solution, I was more than convinced. Cloud Monitor has been one of the best technology decisions I’ve made this year.”
Ed Newman
CSO & Director of Technology Services
ESC 12, TX
“We have GoGuardian to manage students on a browser level. But it’s not even in the same ballpark as Cloud Monitor. It is the forensics tool that I use to get Google Workspace information our campus safety team needs to properly follow up with potential issues and incidents. Cloud Monitor is an invaluable tool for keeping our Google for Education environment and, to a degree, our campus a safe place for students to thrive.”
Justin Feltus
System Specialist
Bremerton School District
“At the time I was contacted by ManagedMethods, I really wasn’t looking for a solution. I knew I had a problem because the state had recently passed a law requiring school districts to adhere to some of the NIST standards. The monitoring and tracking user accounts requirements in the NIST standards play right into the Cloud Monitor platform and it’s the perfect fit.”
Neal Richardson
Director of Technology
Hillsboro-Deering School District
Cloud Monitor Makes Data Security & Student Safety In Google And Microsoft Easy


HOW IT WORKS
-
FIND CYBER SAFETY & SECURITY RISKS IN GOOGLE WORKSPACE & MICROSOFT 365
Cloud Monitor provides K-12 IT teams with an easy, affordable way to identify cyber safety signals and data security risks in district Google Workspace and Microsoft 365 accounts.
Cloud Monitor continually monitors and audits your domain's Google Workspace for Education and/or Microsoft 365 for Education environment. This includes all files stored in Drive and Shared Drives, Gmail, Google Meet, and Google Chat, all Microsoft 365 files stored in SharePoint and OneDrive, Outlook 365, and Exchange. Set up automated cyber safety signals and data security risk policies and audit reports to keep on top of what is going on in your district’s cloud apps.
LEARN MORE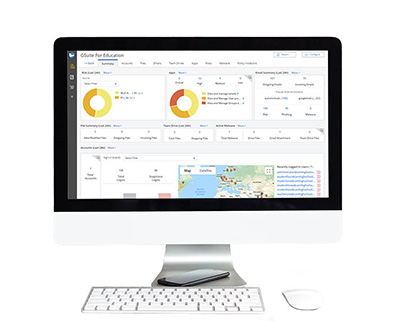
-
SECURE DATA & MONITOR STUDENT SAFETY SIGNALS
Cloud Monitor is an enterprise-grade cloud security platform built specifically for the unique needs of IT teams in K-12 school districts.
Cloud Monitor will automatically protect sensitive student, parent/guardian, and staff data stored in Google Workspace and Microsoft 365 from accidental loss and malicious theft. The platform also monitors district cloud apps for student safety signals, including cyberbullying, threats of violence, inappropriate images and videos, and advanced machine learning detection of self-harm red flags.
Claim My Free Audit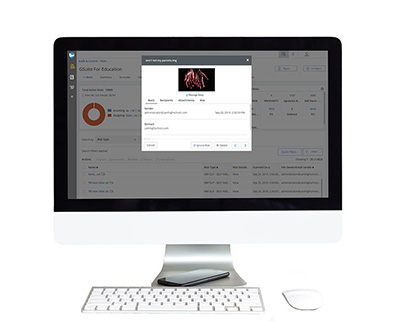
-
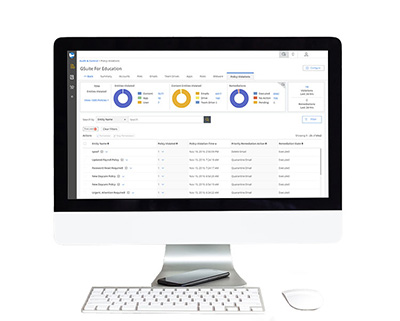
AUTOMATE CYBER SECURITY & SAFETY MANAGEMENT POLICIES
Cloud Monitor deploys in minutes without any impact on your network or end-user experience. With just a few clicks, you will have the full visibility and control over district Google Workspace and Microsoft 365 applications.
Set up automated policies to prevent data loss, detect account takeovers, protect against phishing, malware, and identify student safety signals.
Claim My Free Audit